Density of a material is defined as its mass per unit volume.
ρ (in some countries i.e. USA) is also defined as weight per unit volume
Units: (kg/m³), g/cm³
Arif
Arif
Soong TT. 2004. Fundamentals of Probability and Statistics For Engineers. West Sussex: J Wiley.
Arif
../sT-fold cross-validation (Stone 1974) repeats k times for a sample set randomly divided into k disjoint subsets, each time leaving one set out for testing and the others for training. Thus, we may call this technique “leave some out”
Arif
Enăchescu C. 2008. Approximation capabilities of neural networks. JNAIAM 3(3-4):221-230.
Arif
Approximation Capabilities of Neural Networks. C. Enăchescu, Journal of Numerical Analysis, Industrial and Applied Mathematics (JNAIAM), vol. 3, no. 3-4, 2008, pp. 221-230
From the learning point of view, the approximation of a function is equivalent with the learning problem of a neural network. In this paper we want to show the capabilities of a neural network to approximate arbitrary continuous functions. We have made some experiments in order to confirm the theoretical results.
c48613aed54c29e0f60ca35833aebf70.pdf
 is a continuous function
Neural Network and Best Approximation Theory
Given  and
and  we call the distance of f from A as
Arif
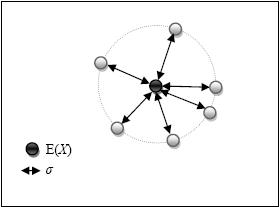
Easiest description for standard deviation definition is distance from mean (expected value) as shown in this graphical depiction

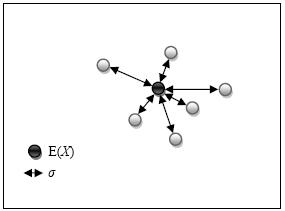
where all the values fall at σ distance within the dotted circle radius. Of course a more real-life situation is shown as

where σ is the square root of the following mean

σ² a.k.a. variance is averaged quadratic distances. Explanation:
Distance may have several concepts, in this variance description, distance shows “how far” a value is from its population expected value (mean). Quadratic form of this “how far” is

Arif
Between different sulfonation which results in different IFT, standard deviation of these parameters are
viscosity : 21.0 - 24.7

pH : 0.11 - 0.13

density : 0.015 - 0.018

IFT : 0.015 - 0.033
Arif
(historical effort)
A plot showing surface tension as function of pH showed quite similar relative changes in pH 5-9. Johlin measured using sessile bubble method with different timing (hours) to expect equilibrium.
However, the pattern isn’t the same as Sugden’ result that was imposed over the same plot.
Arif
Danielli JF. 1937. The Relations between Surface pH, Ion Concentrations and Interfacial Tension. Proceedings of the Royal Society of London. Series B, Biological Sciences, Vol. 122, No. 827 (Apr. 1, 1937), pp. 155-174
Arif
Petelska AD, Naumowicz M, Figaszewski ZA. 2002. Interfacial tension of the bilayer lipid membrane. Cell Moll Biol Lett 7:212.
A regularity has been found: a larger hydrophilic head gives rise to a lower interfacial tension. A relationship was found between the size of the hydrophilic head of lipid and the isoelectric point pH value. With larger hydrophilic heads, the isoelectric point appears at lower pH.
abstract:
Vol7_suppl_05_39.pdf