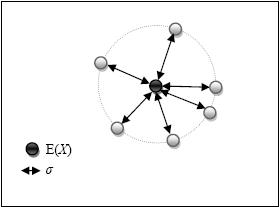
Easiest description for standard deviation definition is distance from mean (expected value) as shown in this graphical depiction

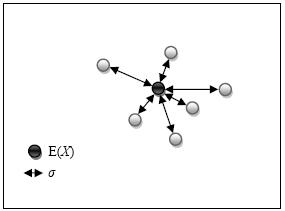
where all the values fall at σ distance within the dotted circle radius. Of course a more real-life situation is shown as

where σ is the square root of the following mean

σ² a.k.a. variance is averaged quadratic distances. Explanation:
Distance may have several concepts, in this variance description, distance shows “how far” a value is from its population expected value (mean). Quadratic form of this “how far” is
